Its been a really long time since I made any posts, sorry for that but work sometimes gets in the way of the things I like doing, like updating my blog.
This post might seem a bit stupid but I tried to find out how to do this on the web and it was quite impossible to find a easy step by step guide for making a XY plot in Aspen Plus for use in the McCabe Thiele method for designing a distillation coulomb, so I had to figure it out myself after a lot of fellow class mates had the same problem as me.
So without any further a dew here is my 13 steps to making a XY plot in Aspen Plus for a binary mixture.
For this example I used the old classic ethanol and water problem.
Step1: Open Aspen Plus and this is the first screen to pop up. Choose "Blank Simulation" an press "Ok"
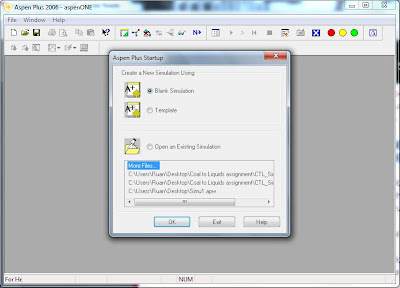 |
| Step 1: Begin new Aspen simulation |
Step2: You are now in the simulation environment and to start the simulation you need to enter the "Data Browser" (Usual simulations you would firstly need to drag in a few components and streams, but for the XY Plot it unnecessary)
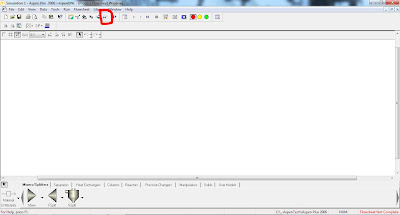 |
| Step2: Click on the "Data Browser" button |
Step3: Give your simulation a "Title", "Units of Measurement" you prefer, the most important part of this step is to define your "Run Type" as "Property Analysis".
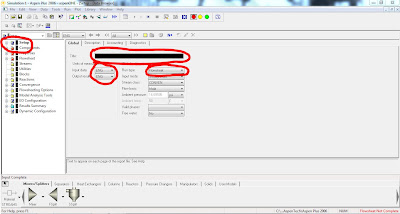 |
| Step3: Start by entering "Setup" information |
Step4: Make sure you selected "Property Analysis" as "Run Type" and then click the "Next" button to take you to the following necessary input section for a complete simulation.
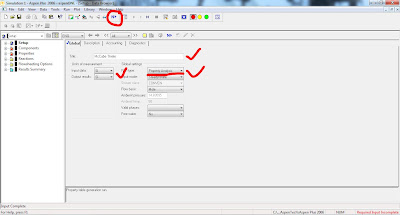 |
| Step4: Make sure you selected "Property Analysis" as "Run Type" |
Step5: The following screen will appear before you, the "Components"/"Specifications" screen, here you need to select the components you want to use in your system by either typing it directly into the "Component ID" cell or by clicking on the "Find" button at the bottom of the screen and the searching for the various components. ( I selected Ethanol and Water as my two components, and remember that there can be multiple components in your system, and when making your XY diagram you can select only the two components that you are interested in) Click on the "Next" button.
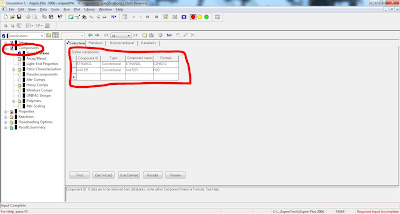 |
| Step5: Chose the components in your system |
Step6: The "Properties"/"Specification" screen will come up next, here you need to choose the method used for solving you binary solution. This is actually a very important step in your simulation, so you either need to know the method that suites your behavior of the components you chose or use for example the Eric Carlson or Bob Seader decisions tree to determine the method use for the simulation.
I chose the NRTL method as the "Base method", and Aspen Plus automatically uses it for the "Property Method".
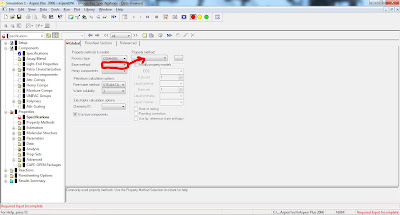 |
| Step6: Choose a Property Method |
Step7: Ensure that the correct base and property methods are chosen and click "Next".
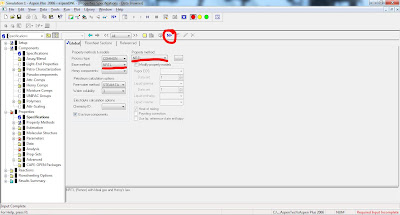 |
| Step7: What you should have by now |
Step8: The following screen will appear, make sure your components are correct and click "Next"
 |
Step8: Make sure you have the correct components
|
Step9: The following popup will appear on your screen, just press "OK"
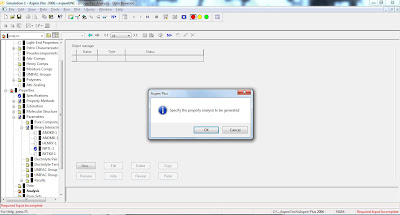 |
| Step9: Just click OK |
Step10: Go to "Tools"/"Analysis"/"Property" and select "Binary"
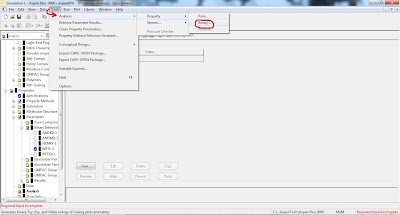 |
| Step10: Getting the simulation/plot started |
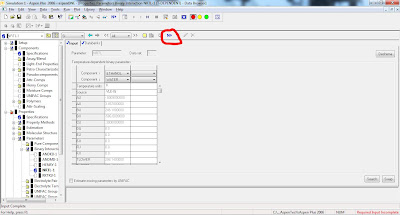
Step11: Choose "Txy" as the "Analysis Type". On this screen there are a lot of parameters that you can change to suite your simulation conditions, for my example I just kept the pressure as 1 atm/101325 Pa just make sure your basis is correct and and the component you are interested in is selected. Click "Go"
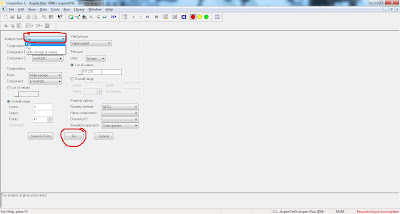 |
| Step11: Begin Analysis |
Step12: You will get a typical Txy diagram, depending on your components and property method, but this is not the same as the XY diagram we need for McCabe Thiele. Minimize the Txy diagram.
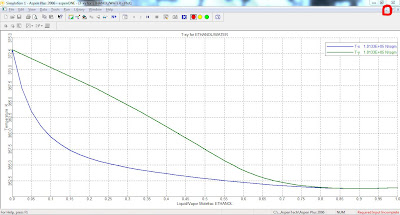 |
| Step12: A typical Txy diagram |
Step13: You are suppose to have the following screen in front of you, if not just check your screen for the "Binary Analysis Results" window and click on the "Plot Wizard" button.
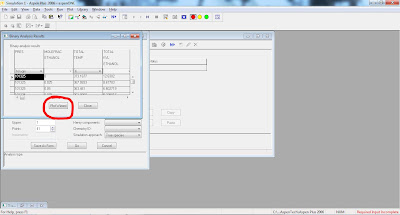 |
| Step13: View your binary analysis screen |
The following window will appear, select YX as your plot type, click "next", there are two more windows where you can customize your XY plot, I chose the standard settings and just clicked "Finish" after I selected the plot type.
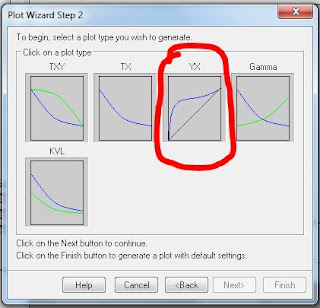 |
| Step13.2: Select your chart type |
Final Product: Voila, you have your own personal XY curve for designing a condenser.
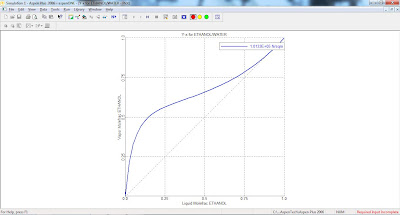 |
| The XY curve used for McCabe Thiele method |
I hope this was of any help, and feel free to leave any comments to help me improve this post.


your work is very interesting, thank
ReplyDeletei tried to do the same but i have a problem in my plot wizard, it does not display the plot types (plot wizard step 2)
are you familiar with this situation ?
Yes that was exactly the problem I had initially, just make sure that you close or minimize the original graph that the binary analisys creates, and then re-enter the plot wizard to find window wich offers multiple plot types available in ASPEN. If this isn't what your problem is, please try and explain a little beter.
ReplyDeleteExcelent! thanks, jus one more quesion, if I want the resuts as a Tabe in order to work with them in excel or in origin is it posible?
ReplyDeleteWithout Further Ado*
ReplyDeletei would like to know whether its possible to draw curves like mass flow rate vs tempertaure/pressure or not. i have been working on heat exchangers in aspen plus and need these curves.
ReplyDeletethanks